- Creating Graph with VB.NET, Part 1: Basic Chart
- Creating Graph with VB.NET, Part 2: Customize Chart
- Creating Graph with VB.NET, Part 3: Data Binding Chart to Database
This series shows how to create chart or graph with VB.NET using Microsoft Chart Controls for .NET Framework.
I divide the series into 3 parts:
- Creating Graph with VB.NET, Part 1: Basic Chart
- Creating Graph with VB.NET, Part 2: Customize Chart
- Creating Graph with VB.NET, Part 3: Data Binding Chart to Database
On this post, you will learn how to create a basic chart on Windows Form Application with VB.NET. I use Microsoft Visual Studio 2005 as IDE.
Requirement
- Microsoft Visual Studio 2005 or later.
- .NET Framework 3.5 SP1 or later. You can download Microsoft .NET Framework 3.5 Service Pack 1 from Microsoft website.
- Microsoft Chart Controls for Microsoft .NET Framework 3.5
Step-by-step to create basic chart on VB.NET
- Install the requirement software as stated on the Requirement section.
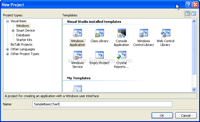
- Open Microsoft Visual Studio 2005. Create a new VB.NET’s Windows Application. Type the name of the project as “SampleBasicChart“.
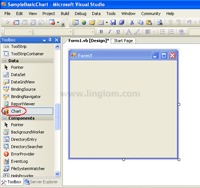
- On Toolbox window, drag a Chart control from the Data category to the Windows Form.
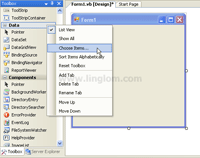
Note: If you does not see the Chart control in the Toolbox, you need to perform these steps below:- Right-click on the Toolbox window and select Choose Items.
- On Choose Toolbox Items, click Browse.
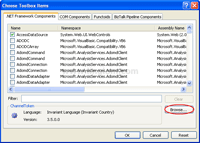
- Browse to the location where you have installed Microsoft Chart Controls. The default location is
C:\Program Files\Microsoft Chart Controls\Assemblies and select System.Windows.Forms.DataVisualization.dll. Then, click Open.
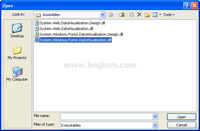
- You see Chart control has been added to .NET Framework Components. Verify that its check box is checked and click OK.
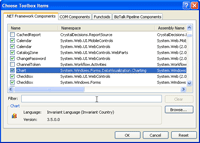
- Right-click on the Toolbox window and select Choose Items.
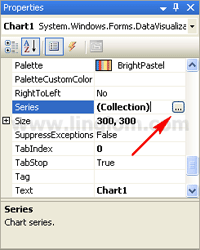
- On Chart Properties, you see an empty chart with a default series, “Series1“. Next, I’m going to add another Series. On Chart Properties, click the Series collection. Then, click the ellipsis button.
- On Series Collection Editor, click Add. You will see “Series2” has been added to the collection.
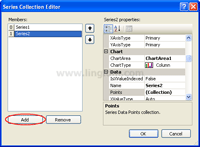
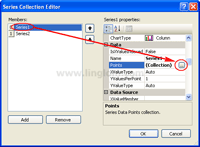
- Now you have two series on a chart. But there is not any data on the chart so I will add some example data point on each series. Select Series1 and click the ellipsis button on Points collection.
- On Series Collection Editor, select “Series1” in the Members area and click the Points collection property. Then, click the ellipsis button.
- On DataPoint Collection Editor, click Add and assign a value “10” to the YValues property in the newly created DataPoint object.
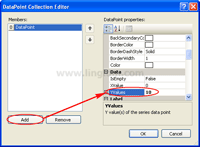
- Repeat step 8 to add two more DataPoint object with values “20” and “30” repectively. Then, click OK to close the DataPoint Collection Editor window.
Note: These values are example values, you may use any value as you want. - Repeat step 7-9 again on “Series2” with YValues as you want. Then, click OK to close the Series Collection Editor windows.
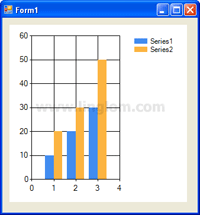
- Run the project. You see the chart with two series as you created.
It’s helpful.
thanks a lot!
Thank a lot ,It’s Helpful.
you are great
raxmat, ko`p yordam berdi
Great website. Plenty of helpful info here. I am sending it to some buddies ans also sharing in delicious. And naturally, thank you to your effort!
This is very helpful..
But I have a problem in this step:
“Browse to the location where you have installed Microsoft Chart Controls. The default location is
C:\Program Files\Microsoft Chart Controls\Assemblies and select System.Windows.Forms.DataVisualization.dll. Then, click Open.”
I can’t find such a file…
I appreciate if anyone tells me what to do… Thank you in advance !
I have a problem when I “Browse to the location where you have installed Microsoft Chart Controls. The default location is
C:\Program Files(86x)\Microsoft Chart Controls\Assemblies and select System.Windows.Forms.DataVisualization.dll. Then, click Open.â€
this toolbox is turn off and it does not work!!! how I can turn it on?
Thanks