- Creating Graph with VB.NET, Part 1: Basic Chart
- Creating Graph with VB.NET, Part 2: Customize Chart
- Creating Graph with VB.NET, Part 3: Data Binding Chart to Database
On Part 1: Basic Chart, I show how to create a basic chart with default chart type and color style. Now you will see how to customize chart by change those properties on a chart.
Sections
Sample chart
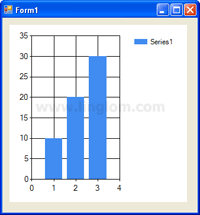
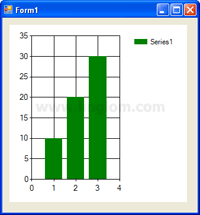
The sample chart that I use on this post has a series “Series1” which has 3 data points “10,20,30“.
Customize chart type
There are many chart types that you can select for Chart control. On this example, I show some of those chart types which are Point, Line, Bar, Pie.
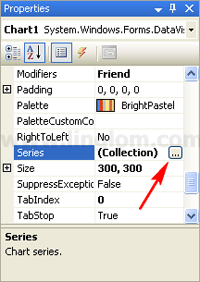
- On Chart Properties, click the Series collection. Then, click the ellipsis button.
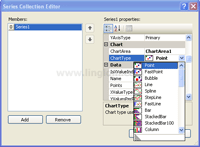
- On Series Collection Editor, select “Series1” in the Members area and change the Chart type property to Point.
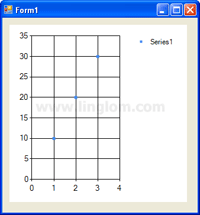
- The Point chart type.
- The Line chart type.
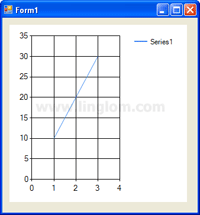
- The Bar chart type.
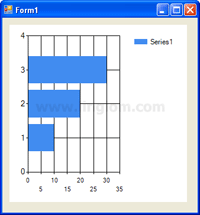
- The Pie chart type.
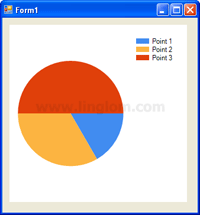
Customize Color style of chart
There are many color palettes that you can choose for Chart control. This section shows how to change color of Chart control.
- On Chart Properties, click on Palette property. You see a drop down button. Click on it and you can choose a color palette for your chart.
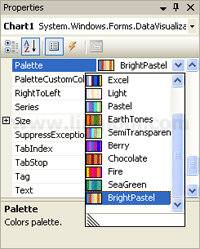
- The example below is Bright color palette.
Insert title to chart
This section shows how to insert title to Chart control.
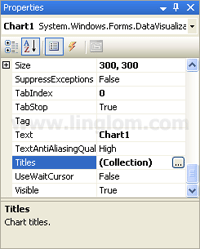
- On Chart Properties, click the Title collection. Then, click the ellipsis button.
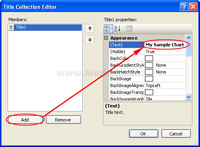
- On Title Collection Editor, click Add and set (Text) to “My Sample Chart” in the newly created Title object.
- Run the project. You will see a title on top of the chart.
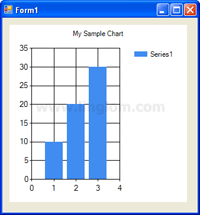
- You can customize title’s text style, title position, title color on title properties.
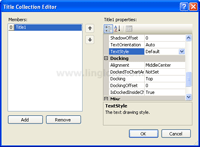
3D chart
This section shows how to use three-dimensional (3D) chart areas in Chart control.
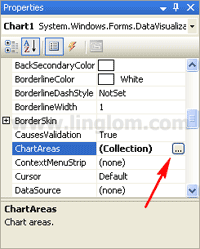
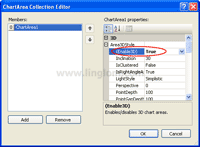
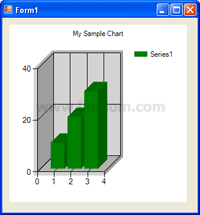
This is exactly what I was looking for.
Is Part 3 of the tutorial available yet ?
My tired old eyes must be failing me as I only see parts one and two !!!
Great help. This was the only site that actully said it ALL.
how to display voting results in the form of bar graph reading automatically from sql database on asp.net application, using vb.net.
Great Help. I cannot get to 3D settings in VB2010 express. Is it disabled in “express” or there is some problem in my VB?
Good work Dear….thanks….
hi,
nice job here,
how can i plot a graph of data i just acquired through the com ports of my PC in real time. thanks