- Creating Graph with VB.NET, Part 1: Basic Chart
- Creating Graph with VB.NET, Part 2: Customize Chart
- Creating Graph with VB.NET, Part 3: Data Binding Chart to Database
From Part 1: Basic Chart and Part 2: Customize Chart, you see how to create a basic chart using GUI (no coding). But the chart is static, it’s lack flexibility which means that you cannot change properties or data of the chart while the application is running. Therefore, I will show how to create a chart by coding and bind data from a SQL Server’s database to the Chart control.On this example, I will create a connection to “Northwind” database on this SQL Server “BKKSQL001\INSTANCE01” and query product name and units in stock from “Products” table. Then, I create a chart and bind the query’s result to the chart.
Step-by-step to implement data binding chart to database
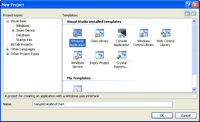
- Create a new Windows Application project on VB.NET and type name as “SampleDataBindChart“.

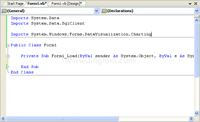
- On Form1, open code window and import these libraries. The first two libraries are used for SQL. The last one is used for Chart.
Imports System.Data
Imports System.Data.SqlClient

Imports System.Windows.Forms.DataVisualization.Charting
- Type code below on Form1_Load().
1
2
3
4
5
6
7
8
9
10
11
12
13
14
15
16
17
18
19
20
21
22
23
24
25
26
27
28
29
30
31
32
33
34
        Dim strConn As String = "Data Source=BKKSQL001\INSTANCE01;" & _
            "Initial Catalog=Northwind;Integrated Security=True"

        Dim conn As New SqlConnection(strConn)

        Dim sqlProducts As String = "SELECT Top 8 ProductName, UnitsInStock FROM Products"
        Dim da As New SqlDataAdapter(sqlProducts, conn)
        Dim ds As New DataSet()
        da.Fill(ds, "Products")

        Dim ChartArea1 As ChartArea = New ChartArea()
        Dim Legend1 As Legend = New Legend()
        Dim Series1 As Series = New Series()
        Dim Chart1 = New Chart()
        Me.Controls.Add(Chart1)

        ChartArea1.Name = "ChartArea1"
        Chart1.ChartAreas.Add(ChartArea1)
        Legend1.Name = "Legend1"
        Chart1.Legends.Add(Legend1)
        Chart1.Location = New System.Drawing.Point(13, 13)
        Chart1.Name = "Chart1"
        Series1.ChartArea = "ChartArea1"
        Series1.Legend = "Legend1"
        Series1.Name = "Series1"
        Chart1.Series.Add(Series1)
        Chart1.Size = New System.Drawing.Size(800, 400)
        Chart1.TabIndex = 0
        Chart1.Text = "Chart1"

        Chart1.Series("Series1").XValueMember = "ProductName"
        Chart1.Series("Series1").YValueMembers = "UnitsInStock"

        Chart1.DataSource = ds.Tables("Products")
Code Explanation:
- Line 1-2: Define a connection string to connect to a database on SQL Server.
- Data Source is a SQL Server name.
- Initial Catalog is a database name.
- Set Integrated Security=True to use the current user as identity to access the SQL Server database.
- Line 4: Create a SqlConnection’s object.
- Line 6: Define SQL query string.
- Line 7-9: Execute the query and populate result to DataSet’s object.
- Line 11-14: Create Chart’s objects.
- Line 15: Add Chart’s object to the form.
- Line 17-29: Set Chart’s properties (ChartArea, Legend and Series).
- Line 31-32: Bind column “ProductName” to X-axis and column “UnitsInStock” to Y-axis on the “Series1” Chart.
- Line 34: Set Chart’s data source to the DataTable in the DataSet’s object.
- Line 1-2: Define a connection string to connect to a database on SQL Server.
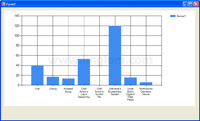
- Run the project. You see a chart displaying “Product Name” on X-axis and “Unit in Stock” on Y-axis which data is gathered from Northwind database on SQL Server.


Good afternoon,
I have a problem with my chart. The x axis does not show all the labels.
I thought it was the size of the chart, but to increase it only shows the font bigger, not the space to display x-axis labels.
what can i do?
PD: Good job, this post is very helpful
Good afternoon it hears in your code marks error to me in Me.Controls.Add (Chart1) in Chart1 says to me that A value of type ‘ System.Windows.Forms.DataVisualization.Charting.C hart’ it is not possible to be turned into ‘ System.Web.UI.Co ntrol’. Can you help me?
GOOD ONE!!!!. Helpful….
Please send me the answers that u provide to both the above mentioned guys.I have a table with fields Name,Absents and Presents.I wanna show a bar graph with complete Names on x-axis and each name having a red bar for absents and a blue bar for presents.Please help me.
Should i use two Series ?
You are great man.I have used your code and i have succeeded.Please put on more tutorials on how to draw pie charts and 3D Graphs.Thank you very much.
Hello, im sad because i cant see how to make the chart show all the names in x axis. it only show 4 names .. please help-me
This Works fine.
I just wanted to ask if there is a way to use line graph instead of bars and which are the properties to do it.
Also, my title is not displayed. Can you help with this, please?
OK, I found, it is not the Chart1, but Series1 property:
Series1.ChartType = SeriesChartType.Line.
Thanks a lot for this tutorial!
Hi,
Thank you for the Very good tutorial,
but m having the same problem with the x axis, The x axis does not show all the labels.
Can you please help me?
maybe it has to do with scale or font size!
I have used your tutorial but i have variables in my SQL statement, comoing from a combo box, i want to be able to update the chart is this possible? I have tried update and refresh but the chart remains the same.
Hi,
I fixed my problem. just need to add the following line:
Chart1.ChartAreas(“ChartArea1”).AxisX.Interval = 1
Best Regards,
Dany
What is the database of this chart. tnx
System.Windows.Forms.DataVisualization.Charting = there were some errors regarding this.
Hi, LL
The database is Northwind. You can see that I defined it in ‘strConn’ variable in code.
Hi, Paula
You have to install Microsoft Chart Controls and add reference the DLL to your project. The control can be download at Microsoft Chart Controls for Microsoft .NET Framework 3.5.
Hi,
Great tutorial. That’s what I needed.Thanks alot.
Great tutorial. Thanks.
my sample view two chart, what happen?
how to plot the grid if read data from the serial com? Thanks
chart1.series.item(“Series1”.points.item(“Point1”).YValue
–> how to give value to this point?
thanks for your code.. is very helpful.. great job..
Thanks for your tutorial! but i want to get the data in the microsoft access and then do to input them in a table. this is the problem. i followed your step and change the sql to Oledb..well. looks like it still doesn’t work,how to solve. pls help me !
ok gan maksih semoga ini bermanfaat untuk ane…
thanks for this!
every thing is blank. only series name show.
please help
Great, however, how do you make scatter plots where the value of x is not just 1,2,3… like in the examples, but any number. That is, plots of a series of (x,y)points.
woooooooooooow!!!!!!
EXCELLENT!
It’s the one that i already searching for this
Hi,
Could you please tell me which namespace and dll we have to add for this line chart.
Thanks
Hey,
Can you tell me/direct me to how I can print the chart once I make it?
Thanks
But how to clear the chart area? to draw another one
how can i put 2 series with code? thanks!
Thanks,it works perfectly..
but i have one problem.
if i refresh the table,i’m not able to load new chart..
The chart’s graph remain the same insted change my series..
How can i reload the chart with new values? (in vb script)..
There’s such “Char1.Refresh()” comand the do this?
(I’ve tryed a lot but can’t solve it)..Thank you
i add first the chart, is it right? but it doesnt work.. it seems like there’s a mistake with da.Fill(ds, “Products”)..
pls help plsplspls
thank you very much 😀
now in know 😀
Great posting! I’ve been searching endlessly through all forums and even my Visual Basic 2010 Step by Step book apparently missed out an entire chapter about graphs. You explained it very well and I was able to use it all and even build on it to customize it to my own needs.
I wonder if you ever though about writing another section on how to play with some of the parameters of the charts in vb.net code, such as change a graph to 3D, or modify the labels to show percentages in a pie chart, etc etc.
how to display all data point. Suppose chart is display monthly (1-31) then only selected data points are show (0, 5, 10, 15, 20)
I have solved myself as – Chart1.ChartAreas(0).AxisX.Interval = 1
Your tutorial help me to much, but I can’t insert into my chart more than 10 data. When I try to put into it all my 300 data, contained in an arrays of double, it shows me only 2 data. Which setting should I adjust in order to make it consider all my values?
Sorry to my bad english
thank you
thanx 🙂
Please send me answers u have provided to top 5 replies
thank you very much for the codes. It helped me a lot.
arlene
thanks a lot. this site is very helpful
For those who got this error:
An unhandled exception of type ‘System.Data.SqlClient.SqlException’ occurred in System.Data.dll
You need to make this slight change:
Use MySqlConnection, MySqlDataAdapter instead of SqlConnection, SqlDataAdapter respectively if you are dealing with MySql Database like in my case.
Nancy Alajarmeh
hi sir. can you help me to make an access database and connect it into vb.net 2010? and once you connect the database of access and automaticaly vb.net will make a graph to it.. please help me.. thx in advance ^_^
This is very helpful, but can you tell me how to use two data sources for my Y-axis? I need series 1 to come from one ds and series 2 to come from another data source. Any assistance will be great.
please how do choose another graph apart from this. like sine wave graph that moves in analogue form.
You could use line chart and check this link.
http://stackoverflow.com/questions/18090878/what-chart-type-do-i-need-for-a-wave-line
Chart is displaying blank. It is not showing any vlaues. Anything i have to in chart properties?
Chart is working fine but how can we plot multiple y values?
Hi, Mohan
Can you describe what kind of data are you trying to plot and what chart type you want?
You could use series to plot 2 Y values. For example, Series1 -> x1,y1 and Series2 -> x1,y2.
hi i wants to read datas from graph. can you give basic tips how these will work in visual basic 10.
thank you!!!
Hi, adugna
If you already have data on a graph and want to retrieve its data. You can use looping to enumerate through each series, point to get X/Y values.
For example, this code returns first X value in the first series.
And this returns the corresponding Y value.
Excellent Tutorial, i got it to work just fine. thanks.
thank you
ERROR THERE IS ANOTHER empty CHART BLOCKING THE DATA
why?
Can anyone please answer my question
why the chart does not get refreshed after updating the table of dataset?
Any help will be appreciable.
Thanks in advance.
To JM,
I have no clue, but I would suggest you to test creating a chart on a new project, starting from a simple chart by use static data. If it works properly, then connect chart to database. This could help identify source of the error.
To Yogender Sharma,
After you update the DataTable, try to clear the chart data, clear the datasource, and reassign it again as sample code below.
I have hunted the Web for a decent example of creating a chart in vb.net (with Visual Studio 2016). This is by far the clearest I have found. With minimal adaption I have created and customised charts from MYSQL databases.
I have turned the charting part into a subroutine and pass different datasetsizes to it as required.
Excellent, thank you.
Hi sir, can you help me to draw the chart. chart axis is X vs Y, Y1 . please let me as soon as possible
Hi sir, can you help me to draw the line chart. It has been performance chart. Axis is X vs Y, Y1 . please let me as soon as possible .
Thank you.
Dany FEBRUARY 25, 2011… you’re Great!!! Thank you very much!!
How to refresh chart with data from database… data source is project data source
Wow! thumbsup….
i don’t care how long the tutorial has been online, the real thing there is that till date still dealing massively.
love it, step by step…
if you don’t get it right, then you must have missed something somewhere….
thanks!
Wow *Pinky Up* LOVING THE CODE BIG MAN YOU WANT TO KNOW WHAT ELSE I LOVE…. YOU <3 xD
you big nice smelling men
I love coding so much that I make my teacher do it. Please give me kisses 🙂